It’s August, and that means back to school craziness for many teachers. So before we get into it today, we want to say a big thank you for taking some time to learn alongside us!
During my time in the classroom, the first few days of the school year always meant three things: permission forms, syllabi, and finding a fun activity to get students excited to be in class with one another and with me. And while I can’t sign your students’ forms or write your syllabus (please don’t say AI), I can definitely help you with the fun activity. For this edition, we’ll focus on a tool you can use to create collaborative activities to start your year: aggregation.
If you’ve been following us for a while you might remember that we already wrote a newsletter about aggregation! Back in July of 2021, we offered this short introduction to the aggregate function and a few tips for displaying aggregate points. We’re taking it a few steps further in this newsletter, discussing how to share student data points, but how to use them for debate in class or just for fun!
|
|
|
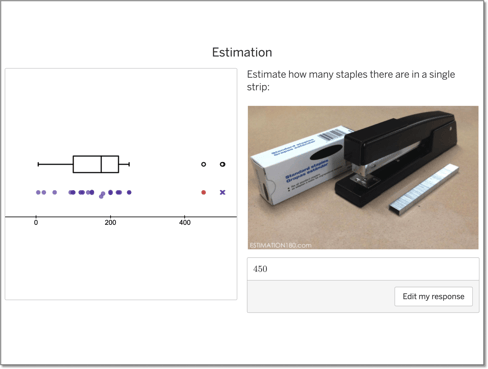
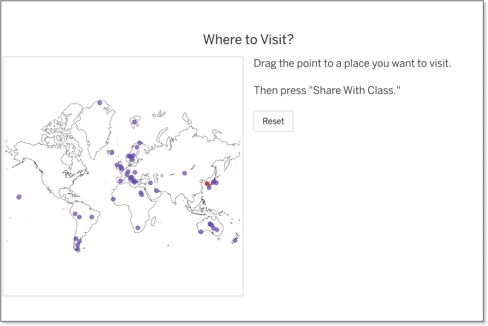
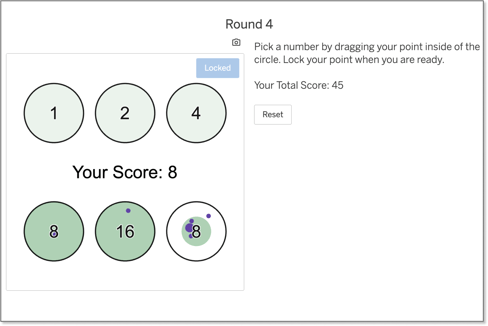
To do that, we’ll take a close look at this activity and talk about different ways you can use the aggregate function to connect student screens.
Aggregating Directly From Student Inputs
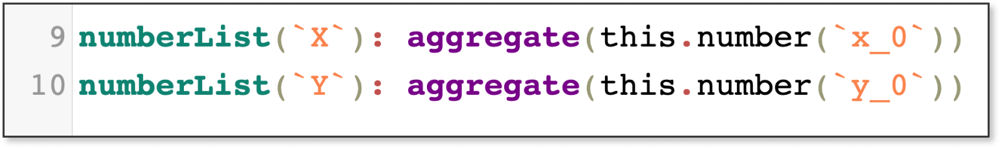
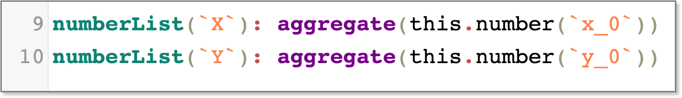
When we think about the aggregate function, this use case is typically the first that comes to mind. Here we take a number from each student (two actually) and use the aggregate function to compile that number into a single list of every student response.
|
|
|
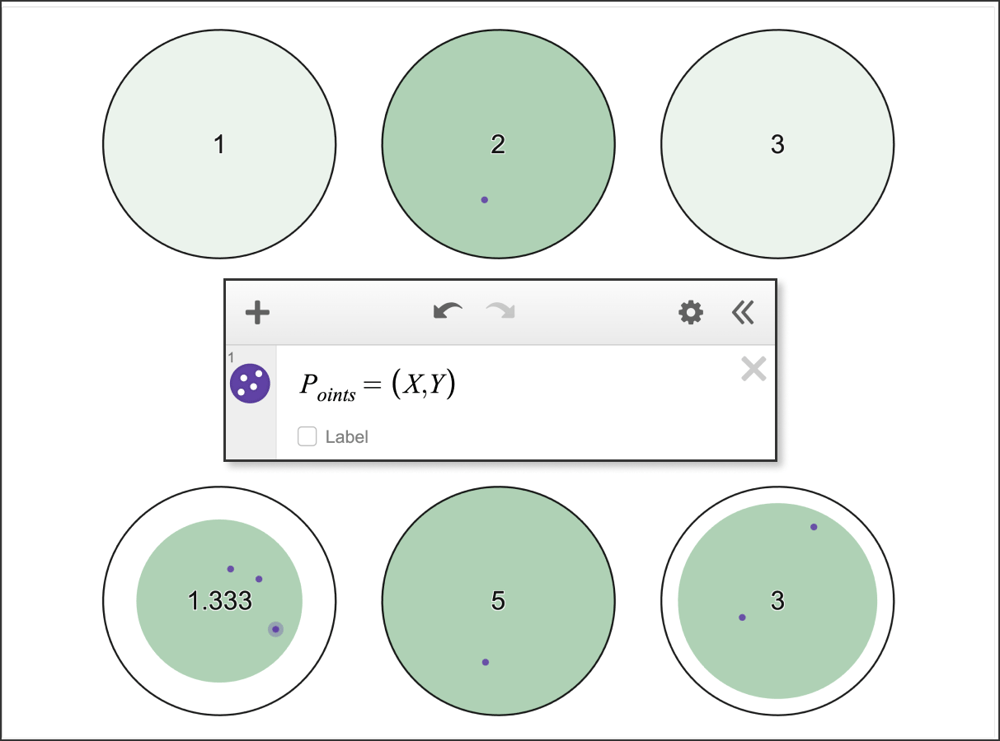
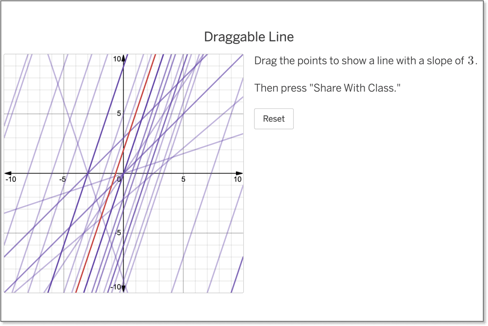
We can then use that number list to display each student’s point in that individual student’s graph.
|
|
|
We can use it for games like this or we can use it to allow students to share a little bit about themselves or spark debate in class.
|
|
|
Calculating Then Aggregating
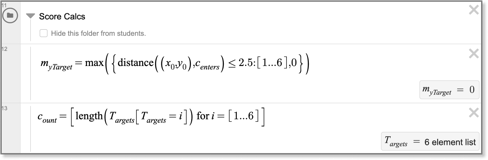
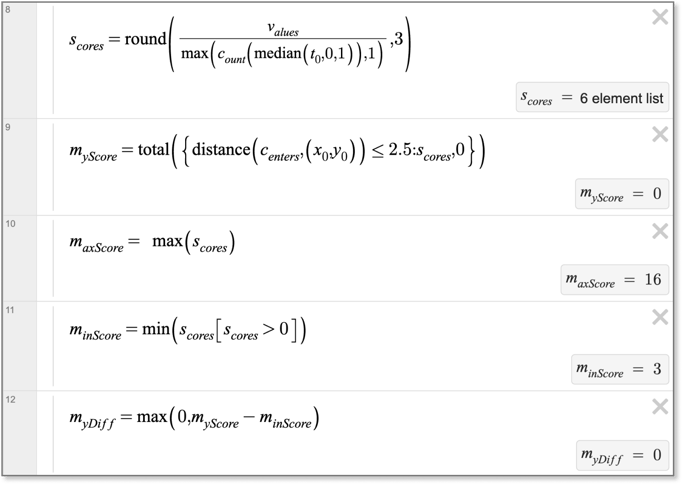
The fun doesn’t stop with student responses! The aggregate function can compile any number into a list, so you can even take a student input, perform a calculation on it to get a desired value, and then aggregate the output as a number list like we did here, by first calculating the target value of each student based on position and then aggregating those values to calculate the actual score:
|
|
|
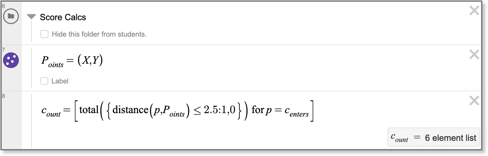
In an example like this one you can also use the aggregate function first and then calculate the scores afterward.
|
|
|
But we’ll talk more about this later in the newsletter.
Aggregating and Re-Aggregating
Sometimes the collection of student results is needed to determine a value (like we did with scoring here).
|
|
|
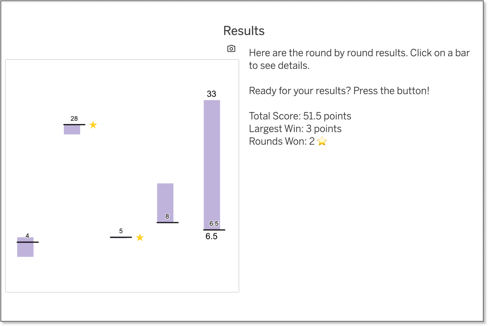
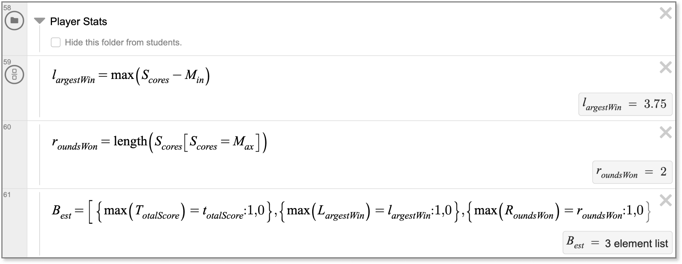
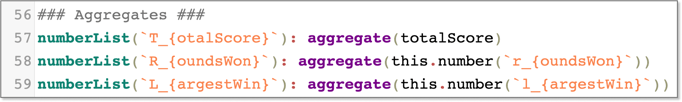
And sometimes you want to take a look at multiple iterations of those based-on-aggregate calculations to gather summary information (e.g., rounds won). You could take the raw aggregate lists and perform multiple calculations that combine several lists, or you could take those values that you’ve already calculated and just aggregate them one more time:
|
Movable points are aggregated.
|
|
|
|
|
|
|
|
|
|
Again, when to use this method vs. the more complicated calculations depends on the calculations you want to do. More on that in a minute.
Balancing Aggregation and Calculation
We know that these two things are true:
- Lots of aggregation can slow an activity down.
- Overcomplicating a graph can slow it down.
In order to keep your activity performant and give students a good experience, it's worthwhile to spend some time thinking about balancing aggregation and calculation. That balance can be tough to find, but watching out for these things might help:
- If your activity is slow to load, or slow on navigation between screens, consider lightening your CL load, including aggregation.
- If a graph is interactive or contains animation, it’ll be most directly affected by the amount of calculation being done in the graph. Remember, a graph that runs smoothly on your computer might not run as smoothly on students’ computers.
- Static graphs that are locked (either by student action or navigation) can handle more inefficiency. If you’re looking to lighten the amount of aggregation and do more calculating in the graph, static screens can do this.
One thing to note: these three things aren’t axiomatic. There may be other mitigating factors that make one method work better than another. Use your judgment (and your gut) to find the right balance.
A Few More Examples
We couldn’t leave you today without sharing a few more light and fun class starters that use aggregation. Enjoy!
|
|
|
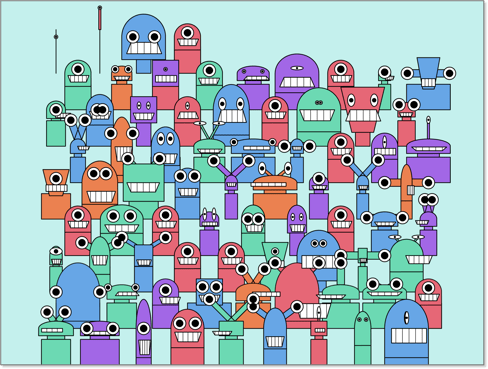
Invite students to create their own robot and add all of the robots to a single "class photo".
|
|
|
|
|
Every student gets a vertex on a single parabola. As a class, organize your points so that no two edges overlap.
|
|
|
|
|
Here's a screen that aggregates the times students set on an analog clock and displays a boxplot of their responses. The polar grid can be switched off in the graph component or kept on for a fun chat about telling time in radians.
|
|
|
|
|
A quick poll with 4 choices. Choices can be edited by the teacher and the class results are displayed in a bar graph.
|
|
|
Your Turn
Finally—Enough of us sharing! We’d love to see what your creative minds come up with! Share your favorite opening-day or start-of-class activities (that use the aggregation function) with #matchMyCL!
|